Kamis, 25 Juni 2015

Forex Guru Trading System for advanced traders - Forex Demo account uk and spread Betting


Forex Guru System trading Instructions :


Enter Buy whent the 2 Movinges Averages Crossed Up and :
1- The (Guru-Angle )                          Gives a green Signal
2- The (Forex Guru of Histogram Indicator )   Gives a green Signal
3- The (Market Emotions    Indicator )        Gives a Green Signal


Enter Sell whent the 2 Movinges Averages Crossed Down and :
1- The Guru-Angle                             Gives a Red Signal
2- The (Forex Guru of Histogram Indicator )   Gives a Red Signal 3- The (Market Emotions    Indicator )        Gives a Red Signal
The Traget = The Stop

15 m Chart ( Target = 15  , Stop = 15 ) or  ( Target = 20  , Stop = 20 ) according to market volatility
30 m Chart ( Target = 30  , Stop = 30 )
1  H Chart ( Target = 50  , Stop = 50 )
4  H Chart ( Target = 100-300  , Stop = 100 )


………………………………………….
for the 4HR chart , It’s preferred to set a Trailing Stop 100 Pips
Or , Move the stop to the Entry point after 100 pips , then continue chase profits
………………………………………….
You Can also Exit When Opposite Signal appears
………………………………………………

The Perfect Session Is The Asian session ( Tokyo , Sydney )

The Best Pairs :

EUR/USD

GBP/USD

USD/JPY


The Best Time Frames :
M 30
M 15


MORE INFO IS GIVEN IN ZIP FILE

don't know how to place the indicator?

The Zip File contains the Following Files:

Forex Guru Indicator of Histogram v3.ex4
GP_Candle TF1H.ex4
GP_Clock.ex4
GP_Diamond.ex4
GP_Heiken Ashi.ex4
GP_MACD_inColor.ex4
GP_Major Trend.ex4
GP_Stochastic_MTF.ex4
GP_TREND.ex4
GP_zigzag_V2.ex4
GPTrend_v22.ex4
Guru-Angle v3.mq4
Market Guru Indicator v3.ex4
forex guru system v3.tpl
Instructions.txt


http://forexwinners.net/wp-content/uploads/2014/01/forex-guru-system-v3.rar

How to Place a Robot or indicator in Metatrader - mt4 and mt5 - Forex trading tips

How To Place ea and indicators and template in metatrader:

Hello Guys Many of you are not familiar with that how can you Place an "ea or a robot or an indicator and template in metatrader in short mt4 or mt5"

Here is the tutorial that how can you Place these files in your meta trader

Step by Step:

First of All open you Metatrader and click on "File" and the Open the "open data folder"

just like image given Below:


Then Go in to "MQL4" Folder 


If you are going to place indicator then choose "indicator" Folder and if you are going to place a robot or ea then choose expert Folder:


Now Just copy the downloaded indicator and paste in indicator folder and if it is a robot then paste the robot file in expert:

Further if there is template file with .tpl extension then place this file in template folder just like the image below


Restart your metatrader and you will see the robot or indicator in your metatrader platform here:


Now Just double click on ea or indicator check "Allow live trading" and enable "Auto trading"and click "ok"


You will see a smiley face in case of ea or robot at the right corner :)

And that's all, congratzz..!! you done this..

Rabu, 24 Juni 2015

100% Profit Forex Trading System - Free download Mt4 indicators


100% Profit Forex Trading System

Hello Guys,

New Arrival of this indicator is here
i do not test it yet..but i hear that its 100% Profit If you Follow the No loss Rules
one more thing is that it is in other language not in english..you have to translate this


put the indi Folder files in your Mt4 indicator folder

and .Tpl file in template folder

restart mt4 and apply the template

Plz share your experience with other traders also in comment section


Zip Folder contains following files:

Free Downlaod 100 % Profit trading system :
CU_R&S_v2.ex4
Donchian Bands.ex4
GP_Clock.ex4
ZIG ZAG NRP.ex4
100% profit.tpl
Manual.pdf ( needs translation )

How to place this indicator?


http://forexwinners.net/wp-content/uploads/2013/02/100-profit.rar

Rabu, 17 Juni 2015

"Bella Fx System" Forex Trend Following Strategy - fx short term trend system


Trend Following Fx Strategy:


Bella Fx strategy:


1. Open a 30 min chart EUR/USD. Insert RSI (14), Stochastic Oscillator (14,3,3)and EMAS 5 and 13.

2. We have to watch for a divergence between the price and the RSI or the Stochastic.

This is very important, because sometimes we don´t see a divergence between the price and the RSI, but the Stochastic show divergence compare to the price, and viceversa.

3. Once we saw the divergence we have to wait for the cross of the EMAS to go long or short.

4. I prefer to open the position with 2 lots and close half the position with 20-30 pips of profit, and move my sl to breakeven with the other lot, in case that the market begin to

trend, we can win more pips, and if the price begin to go against you, you keep the 20-30 of the other lot.

5. Always put sl of 20-25. This strategy presents like 10-12 opportunities in a month and it is 90 % accurate.


6. Avoid to use this strategy when is big news day.

7. In the 15 min chart I had some bad signals and in the one hour chart we enter late to the party of pips. This system can work for the GBP/USD too, but your stop have to be.. like 30-40 pips.  !!!


Jumat, 12 Juni 2015

"PULL BACK" Forex Trading System and strategy - 5 Minute fx techinque

Fx "PULL BACK" Strategy:

The system is all about pullback trading. I find these types of trades to be very profitable, less risky and easier to understand than trend-reversal trades.

I use this system with two pairs GU and EU, and I want to assure you this is more than enough. Otherwise it gets hard when you try to watch more than two pairs. I even find it difficult to watch 2 pairs, because sometimes it leads to missing entries on one of them.

Just remember this; if you master the system you should get no less than 300-400 pips a week from these pairs, guaranteed.


When to trade:

I trade this system during active market hours. I advice to look for entries starting 5 GMT and until 8 GMT (this is when Tokyo session end overlaps with Frankfurt and London openings). And also starting 11 GMT until 15 GMT. (This is after Middle East is done trading, London and Frankfurt are back from their lunch and NY traders kick in later on)

System description:

Basically, all you need for a pullback trading is an established trend. It’s up to you what indicator and TF you will use to find a trend – the greatest thing about forex is that everything works here until you strictly follow the rules. So you just have to pick what suits you the most.

I use 5M TF and a longer term MACD (38, 120, 20) for identifying the trend. (Got it from the great scalping strategy described here: http://www.forexfactory.com/showthread.php?t=90639 )

MACD >0 – trend is up
MACD <0 – trend is down


I also have 50 and 200 EMA on my charts. They act as dynamic S/R lvls and also help me to determine the trend by looking at their positioning in the relation to each other.
The rules are following:

50 EMA > 200EMA – trend is up
50 EMA < 200 EMA – trend is down


It is good to look at the slope of these averages as well. Its better when both of the averages are sloping in one direction and not going sideways (consolidation).

Pullbacks: I use stochastic (14, 3, 3) for identifying pullbacks.
I consider a pullback to be valid if stoch dips below/goes above the 50 lvl.

I also have 15M stoch on my 5M chart which sometimes helps me to filter out fake pullbacks. I want 5M and 15M stochs to align in one direction when I’m entering the trade.


Entry rules: Now these are somewhat subjective, but basically I would advice to do the following. (Described for longs, do opposite for shorts)

Entry:

MACD (38, 120, 20) > 0
50 EMA > 200 EMA and both sloping up
Stoch (14, 3, 3) makes a pullback and goes below 50.

Enter when 5M bar is above 50 EMA and stoch is breaking the 50 lvl upwards. It is important for stoch to build up upwards momentum that is why we want it to be above 50 lvl when we enter the trade.

Stop Loss:

Place SL below the swing low or @ 20-30 pips from your entry point. It shouldn’t be more then that.

Targets:

Well, this is the trickiest part. Here are the few possibilities to consider.

1. Exit at the predetermined amount of pips.
2. Exit at the standard fib extension measured from the pullback.
3. Exit when Stoch (14, 3, 3) goes below overbought lvl of 76.4
4. Exit at the nearest S/R lvl.

Exits are currently the biggest pain in the neck for me, because I never know for sure when to get out. So quite often I end up getting 30 pips where I could’ve gotten 100 or even more. I’m hoping this thread through collaboration of traders will come up with some strict exit rules which will help everyone maximize their profits.


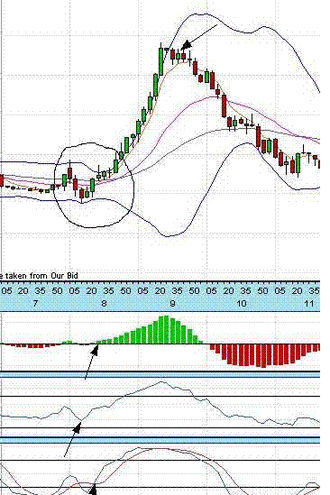
Below are pictures with examples of today’s possibilities.

I took a GU trade and sadly missed the EU. Got out using fib extension on GU @ 44 pips. Entered using market order.

TEMPLATE AND INDICATORS GIVEN BELOW THE IMAGE TO SET THE TEMPLATE: 


Here are the indicators and a current template I'm using. Hope it helps! The only two non-standard indis are KG S/R lvls a (dotted lines on the chart which help me to identify important swing high/lows) and MTF stochastic indicator which allows having 15M stoch on 5M chart.
 DOWNLOAD HERE

File Type: ex4 #KG Support and Resistance Alert_Revision 2.ex4
File Type: ex4 +Stochastics (MTF_for M5).ex4
File Type: tpl plb_5M.tpl

Selasa, 09 Juni 2015

5 Minutes Trading strategy on Major Pairs - Fx Scalping strategies


5 Minutes Trading strategy

 Time Frame 5min

Currency pairs: Majors


 Forex Indicators:


1/ Exponential Moving Averages. 5,20, and 50,

2/ Bollinger Bands, (2, 20)

3/ MACD, ( 12,26,9)

4/ RSI, (14)

5/ Stochastic.(9,3,3)


Rules Entry:

1/ 5EMA crosses the 20EMA and the 50EMA

2/ Candles have moved back inside Bollinger Bands and changes direction

3/ MACD, RSI, Stochastic ALL overbought or oversold.

BUY ENTRY: Circled on the Candle chart 5EMA crossing the 20EMA then

both cross the 50EMA.Candles have moved back inside Bollinger bands and turned

green.

Arrowed Top MACD on an upward trend, RSI on an upward trend, Stochastic

has crossed moving up.

EXIT: Candles have moved back inside Bollinger bands and turned red. MACD, RSI,

Stochastic have peaked. + 64 points.


SELL ENTRY: Circled on the Candle chart 5EMA crossing the 20EMA then

both cross the 50EMA.Candles have moved back inside Bollinger Bands and turned

Red.

Arrowed Top MACD on a downward trend, RSI on a downward trend,

Stochastic has crossed moving down.

EXIT: Candles have moved back inside Bollinger and turned green. MACD,

RSI, Stochastic have peaked. + 68 points


Jumat, 05 Juni 2015

Bollinger Band Forex Scalping Trading strategy - Best fx scalping system

Forex Scalping Strategies:

 Chart Setup

Preferred Currency Pairs: EUR/USD, GBP/USD and GBP/JPY
Preferred Trading Sessions: EUR and US
Timeframe: 5 Min
Indicators: Bollinger Bands (default settings)

Trading Example


 Bollinger Band Scalping Trading Rules


A. Rules For Long Trades

1) Bollinger Bands must slope up.
2) Go long when the price touches the middle BB band from above.
3) Set stop loss at the lower band or max 15 pips (whatever comes first).
4) Take profit at the upper band.


B. Rules For Short Trades

1) Bollinger Bands must slope down.
2) Go short when the price touches the middle BB band from below.
3) Set stop loss at the upper band or max 15 pips (whatever comes first).
4) Take profit at the lower band.


EUR/USD Trades Explained (see picture above)

Trade 1: Bands slope up >> long at 1.3981 (middle band).
Stop loss at the lower band or max 15 pips.
Closed at the upper band 1.3999 for 18 pips profit.

Trade 2: Bands slope down >> short at 1.3986 (middle band).
Stop loss at the lower band or max 15 pips.
Closed at the lower band 1.3971 for 15 pips profit.

Trade 3: Bands slope down >> short at 1.3982 (middle band).
Stop loss at the lower band or max 15 pips.
Closed at the lower band 1.3964 for 18 pips profit.


Trade 4: Bands slope down >> short at 1.3975 (middle band).
Stop loss at the lower band or max 15 pips.
Closed at the lower band 1.3958 for 17 pips profit.


Trade 5: Bands slope down >> short at 1.3965 (middle band).
Stop loss at the lower band or max 15 pips.
Closed at the lower band 1.3950 for 15 pips profit.

Trade 6: Bands slope down >> short at 1.3941 (middle band).

Stop loss at the lower band or max 15 pips.
Stopped out the at upper band 1.3950 for 9 pips loss.

Total Trading Results:

+74 pips in 6 hours of scalping the EUR/USD 5 min chart